


Share
Homepage
News
These stocks could see a good September after forming a ‘golden cross’ chart pattern
These stocks could see a good September after forming a ‘golden cross’ chart pattern
04 tháng 9 2024
A handful of stocks could be poised for a strong September as they head toward what investors typically regard as a bullish price chart pattern.
Stocks have rebounded from a sluggish start to August the month and ended with gains for all three major indexes. The By late Friday, the S&P 500 had advanced about 1.9% this month, while the Dow Jones Industrial Average added 1.5% and the Nasdaq Composite rose 0.2%.
Gains in the S&P 500 and Nasdaq Composite on Friday followed a report on July personal consumption expenditures prices, the Federal Reserve’s preferred measure of inflation, that met Wall Street expectations and reinforced expectations that the central bank is poised to start lowering interest rates at its next policy meeting on Sept. 18.
But some stocks such as Clorox may be signaling just the start of a bullish pattern.
That’s because Clorox belongs to a subset of stocks that have formed, or are on the cusp of forming, a golden cross chart pattern — when their 50-day moving average crosses above their 200-day moving average. Analysts view the move as most meaningful when the stock’s 200-day moving average is sloping upward.
Here’s a look at some of the stocks that appeared when CNBC Pro screened FactSet data in search of golden crosses.
Clorox
Shares of the bleach and Glad bag maker are ahead more than 20% over the past month.
As a result, Clorox’s 200-day moving average is beginning to slope upward, on top of flashing a golden cross. Today’s bullish signal follows a so-called “death cross” chart pattern — the opposite of a golden cross — that came in May.
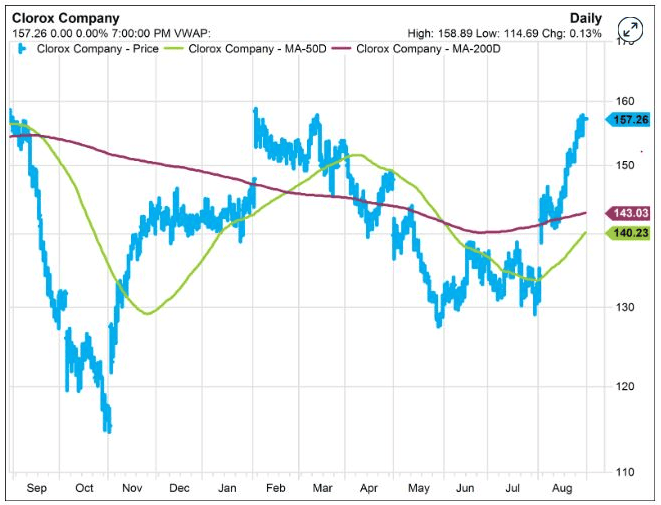
Clorox stock’s 50-day and 200-day moving averages
Investors largely view Clorox as a defensive play in the event the economy slows, and also laud its more than 3% dividend yield.
Clorox surpassed Wall Street’s fiscal fourth-quarter earnings estimates this month, and its fiscal 2025 earnings outlook also exceeded analyst expectations.
Teleflex
Stock in the specialty medical device company are up about 19% in the past three months.
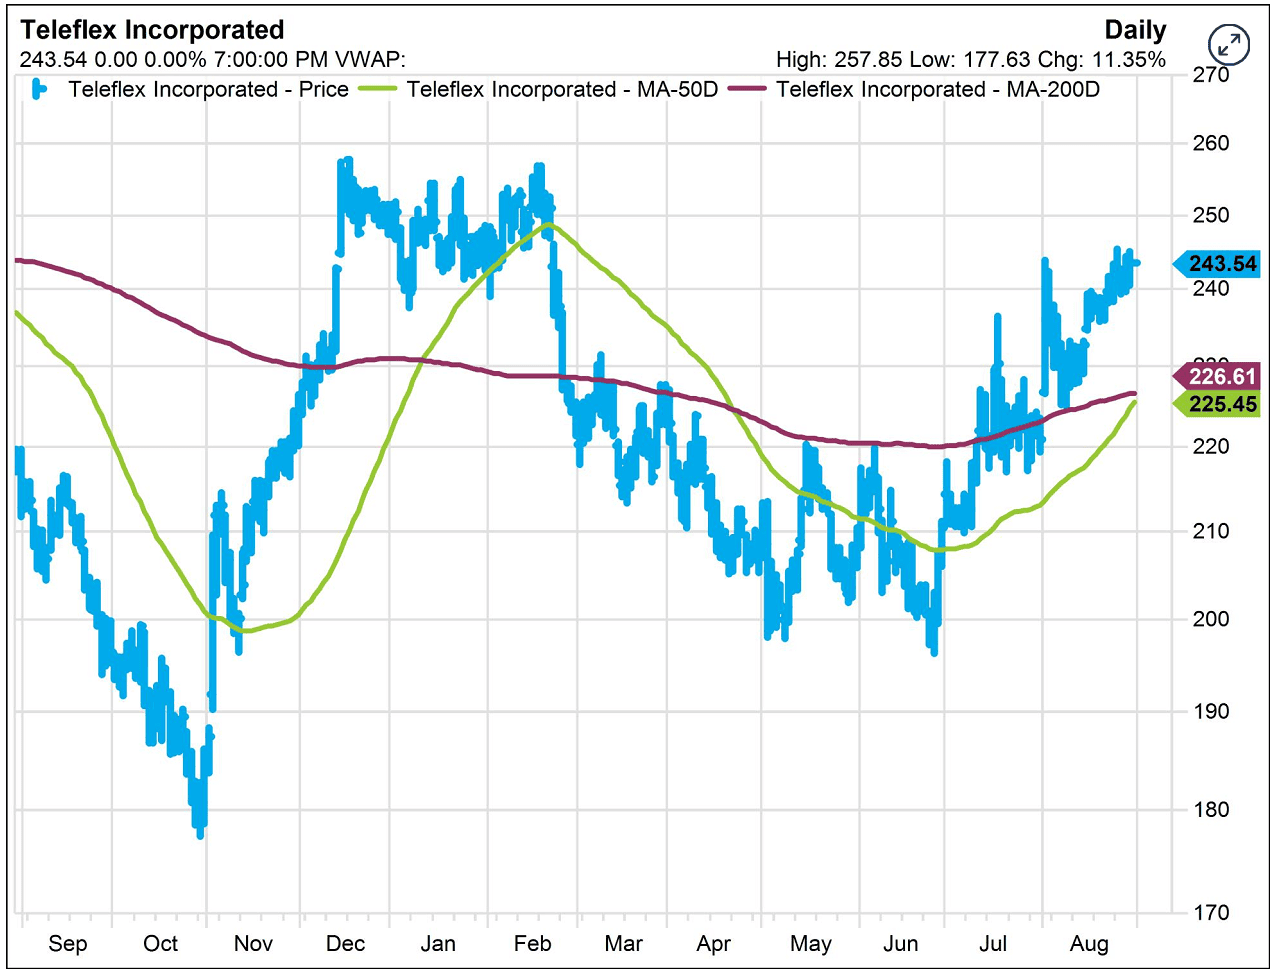
Teleflex’s 50-day and 200-day moving averages
The stock’s 50-day moving average of roughly $225.45 is within easy hailing distance of its $226.61 moving average for the past 200 days.
Teleflex’s second-quarter earnings surpassed Wall Street estimates earlier in August, when it also increased the top end of its full-year guidance.
Piper Sandler analyst Matt O’Brien upgraded Teleflex to overweight from neutral in July, forecasting that earnings pressure could ease next year at the same time as its valuation remains attractive.
Crown Castle
Crown Castle is also signaling a golden cross ahead. Shares of the real estate investment trust have pulled back roughly 3% in 2024 but have advanced more than 12% in the past three months.
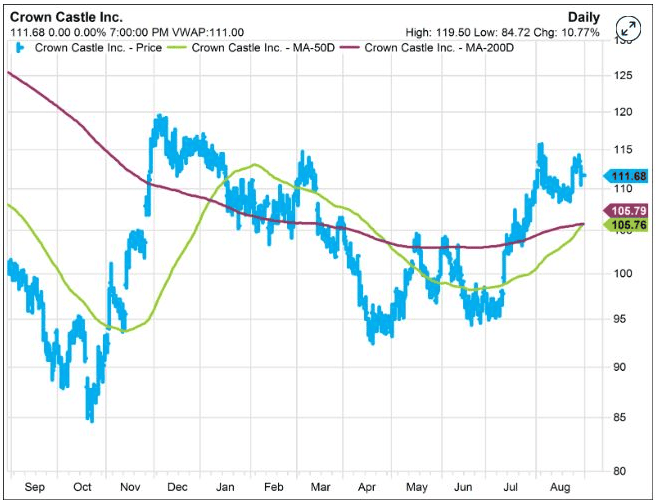
Crown Castle’s 200-day and 50-day moving averages
Match Group
Stock in the online dating platform has soared close to 24% in the past three months.
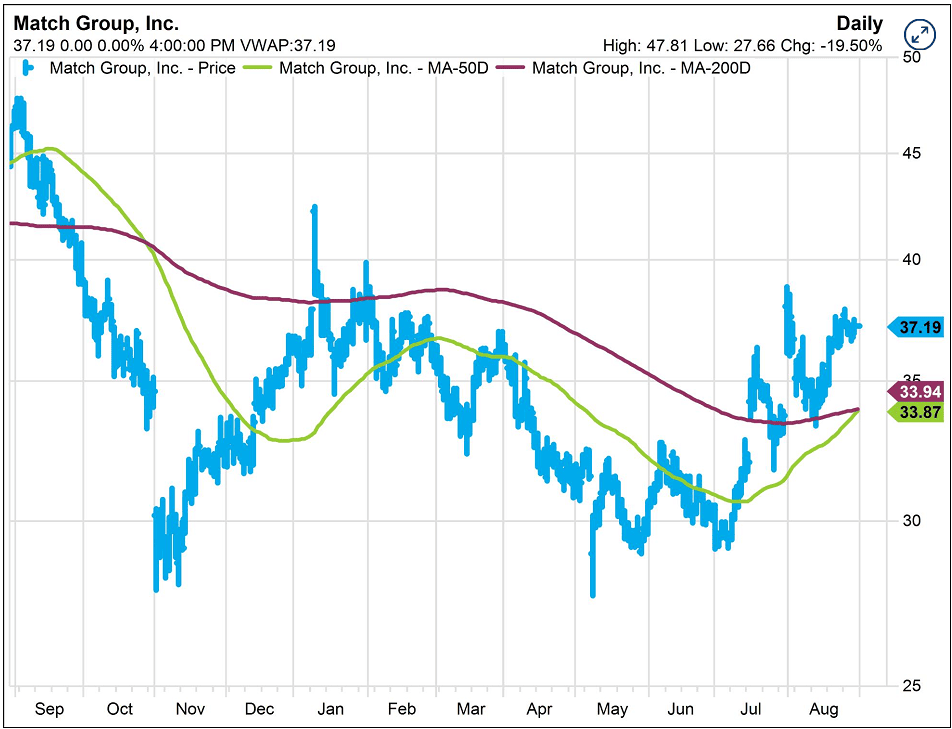
Match Group’s 50-day and 200-day moving averages
The company’s second-quarter revenue surpassed Wall Street estimates in July, totaling some $864 million while analysts polled by FactSet expected $856.5 million.
Prologis
Stock in the warehouse real estate investment trust have surged more than 18% in the past three months.
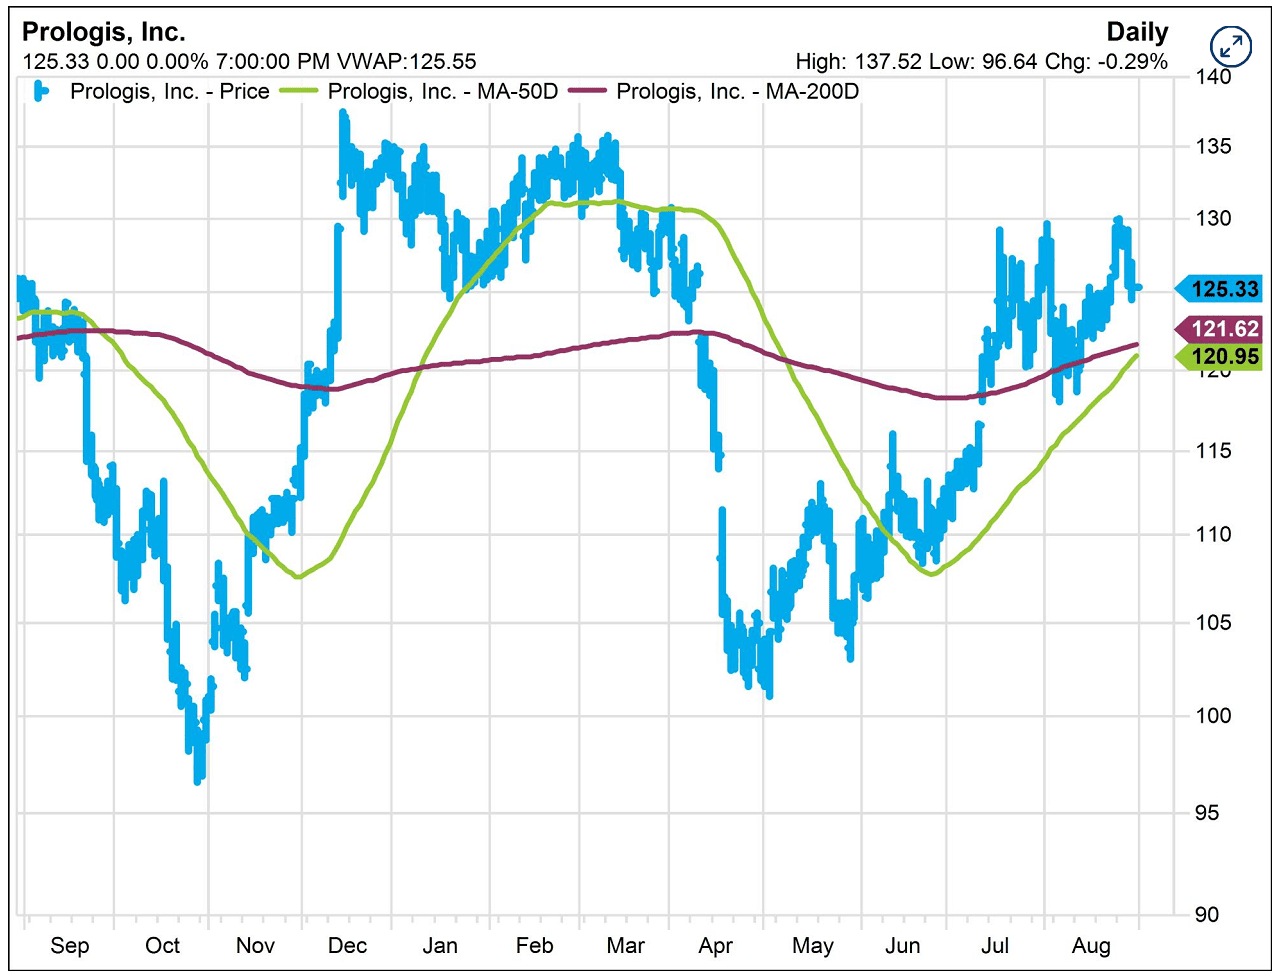
Prologis’ 50-day and 200-day moving averages
cnbc
All information on our website is for general reference only, investors need to consider and take responsibility for all their investment actions. Info Finance is not responsible for any actions of investors.


