


Share
Homepage
News
Key Levels to Watch as Nvidia, Microsoft, Apple Battle for Market Cap Lead
Key Levels to Watch as Nvidia, Microsoft, Apple Battle for Market Cap Lead
19 tháng 6 2024
As Nvidia (NVDA), Microsoft (MSFT), and Apple (AAPL) continue to jostle for the mantle of the world’s most valuable company by market capitalization, we take a look at the weekly chart of each tech behemoth and use technical analysis to identify important chart levels to watch out for.
Nvidia
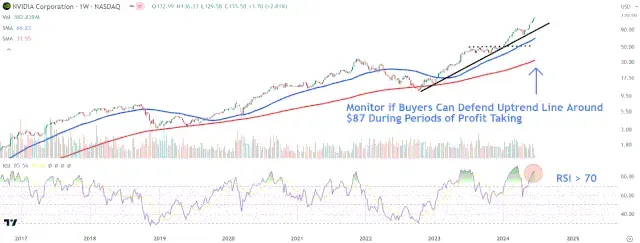
Since bottoming out just below the 200-day moving average (MA) in October last year, Nvidia shares have continued to trend sharply higher, with investors promptly buying any minor dips. In saying that, the stock appears stretched to the upside, given it trades around 56% above a multi-month uptrend line and the relative strength index (RSI) indicates overbought conditions with a reading over the 70 threshold.
During periods of profit-taking, monitor if buyers can defend the uptrend line, currently sitting at around $87. A breakdown below this level could see the shares test the top of a prior consolidation area near $50.
Microsoft
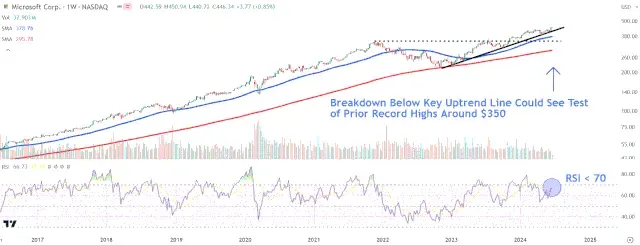
Similar to Nvidia, Microsoft shares have continued to trend strongly upwards since finding support around the 200-day MA in October last year. However, a key difference is that the Microsoft chart indicate less overbought conditions. The price trades within close proximity to an uptrend line extending back to the October low, with the RSI indicator giving a reading below 70. Although the lower RSI suggests the shares have room to move higher it also indicates the stock has less momentum than Nvidia.
Looking ahead, it’s worth keeping an eye on how price responds to the uptrend line. A failure to hold this key technical indicator could act as a catalyst for a decline to two prior record highs in the stock around $350.
Apple
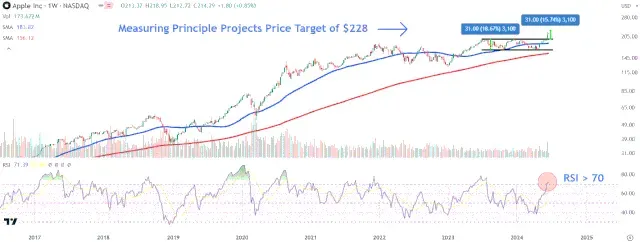
Apple shares traded within a narrow 12-month channel before staging a volume-backed breakout earlier this month after unveiling Apple Intelligence, the iPhone maker’s personalized artificial intelligence (AI) to be installed on its devices. Although, the RSI indicator has recently moved into overbought territory, the stock has ample room to continue moving higher given its extended consolidation before the breakout.
Investors can project a potential price target using the measuring principle. To do this, calculate the distance between the channel’s lower and upper trendlines and add that amount to the breakout point. For example, adding $31 to the $197 breakout point forecasts a price target of $228.
All information on our website is for general reference only, investors need to consider and take responsibility for all their investment actions. Info Finance is not responsible for any actions of investors.


